
Lanius in action
Lanius keeps capture, investigation, and active testing inside one project. This tour follows the workflow from choosing a workspace to cleaning up its saved traffic.
Public demo
The screenshots use public-site traffic. Potentially sensitive request content in the Replay view is deliberately redacted.
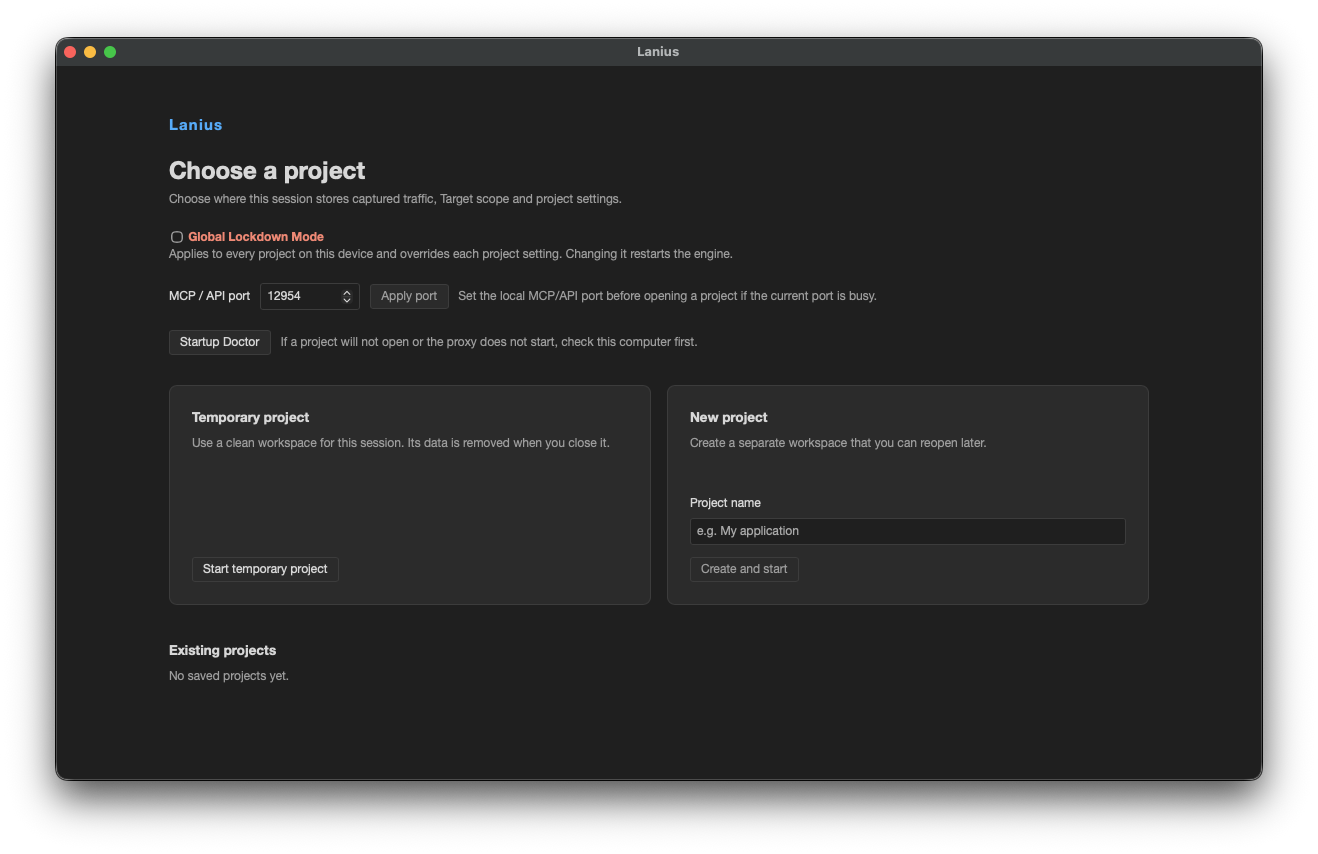 1. Choose a workspaceStart a disposable session, create a named project, or reopen saved work. Global Lockdown Mode and the local API port are available before the engine starts.Projects →
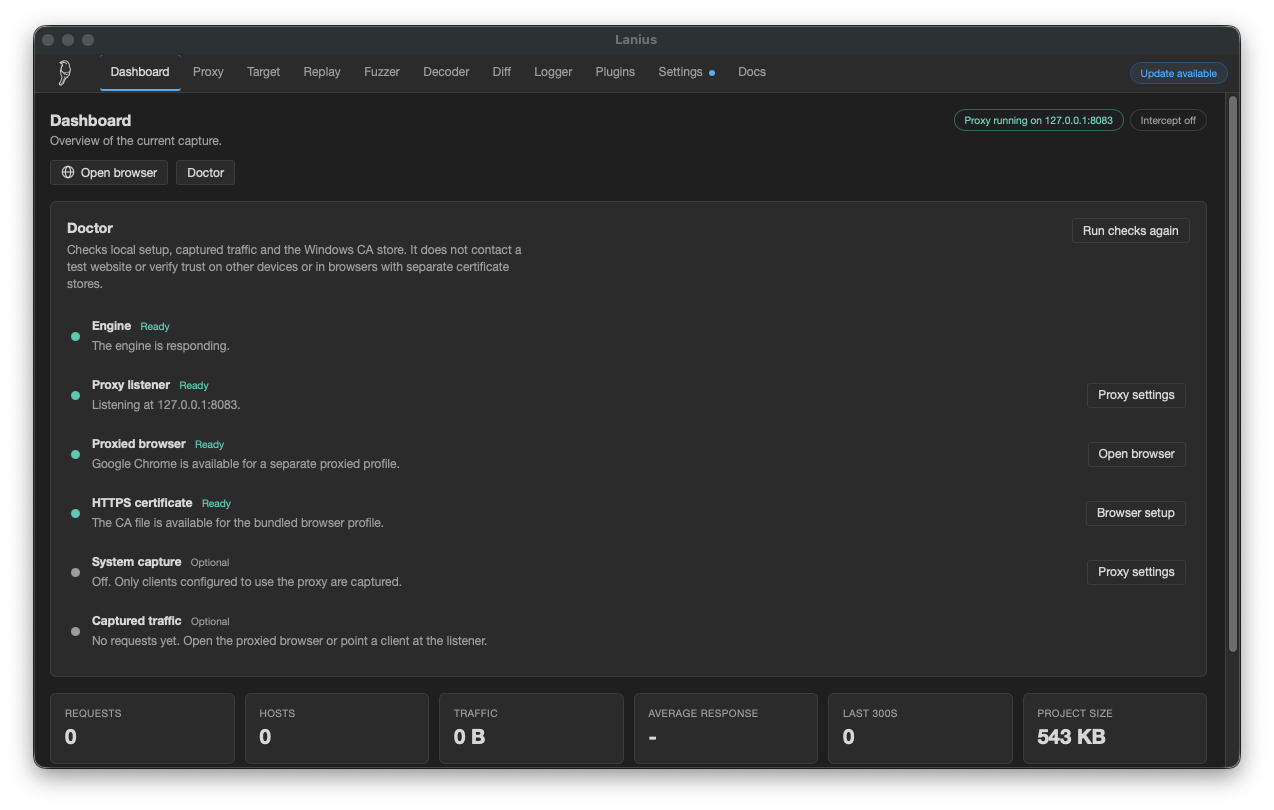 2. Verify the setupDoctor checks the engine, listener, proxied browser, HTTPS certificate, and capture activity, then points directly to the setting that needs attention.Dashboard →
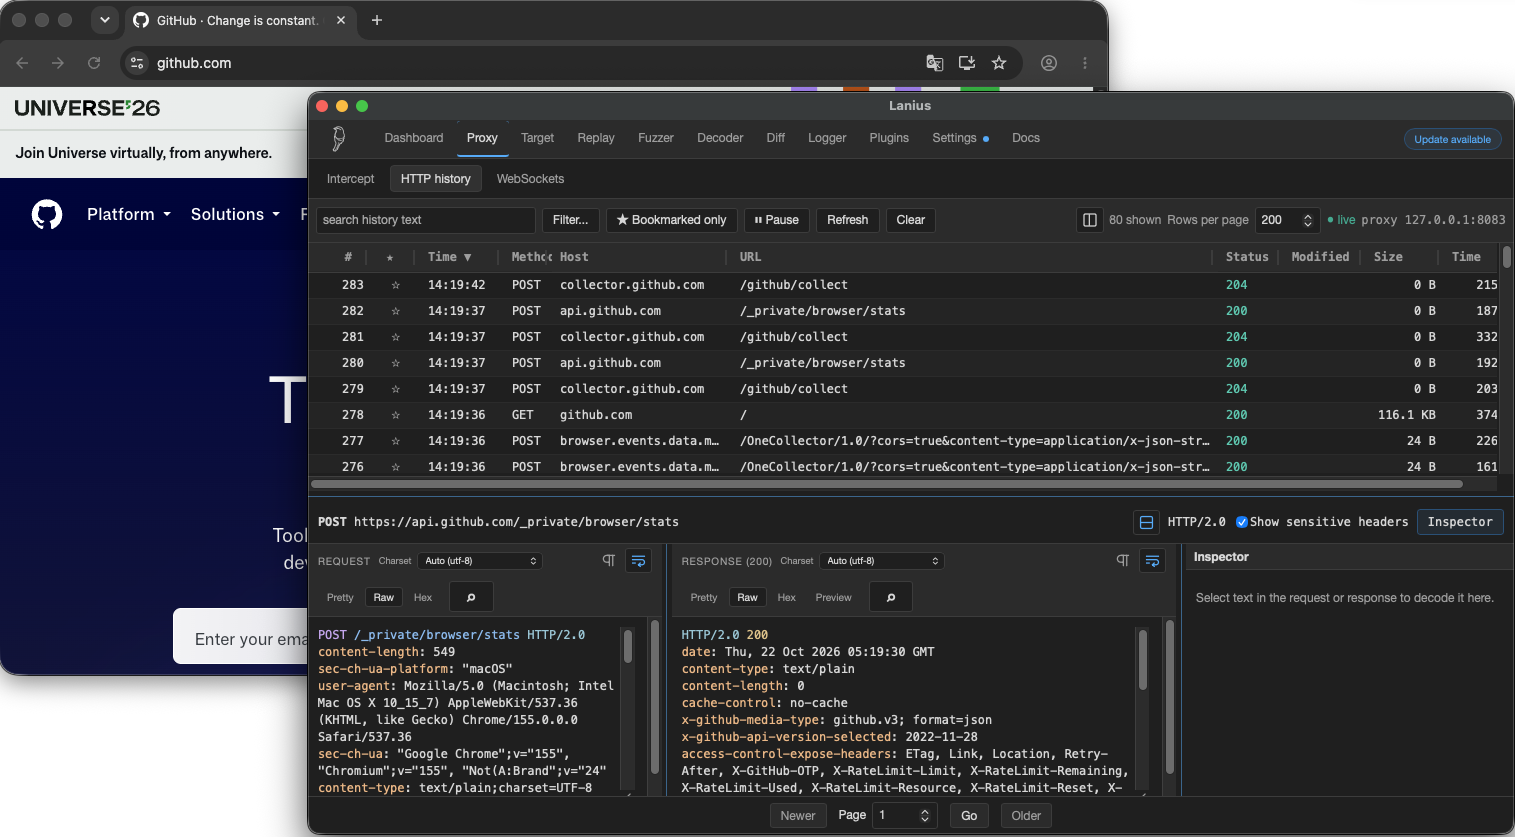 3. Capture live trafficUse the separate proxied browser profile and watch requests arrive in HTTP history. Select any row to inspect the complete request and response.Proxy History →
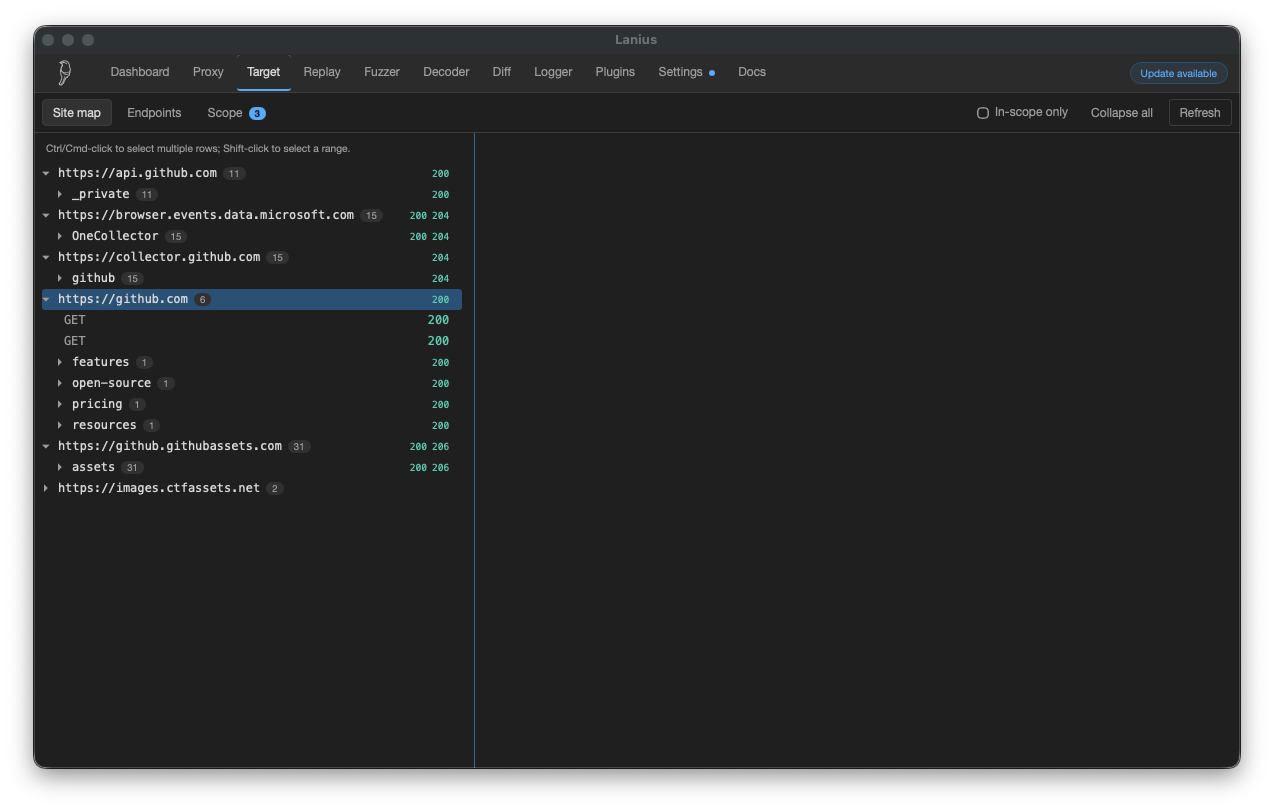 4. Map the attack surfaceCaptured hosts and paths become a navigable site map with methods, status codes, endpoint groups, and scope-aware filtering.Target →
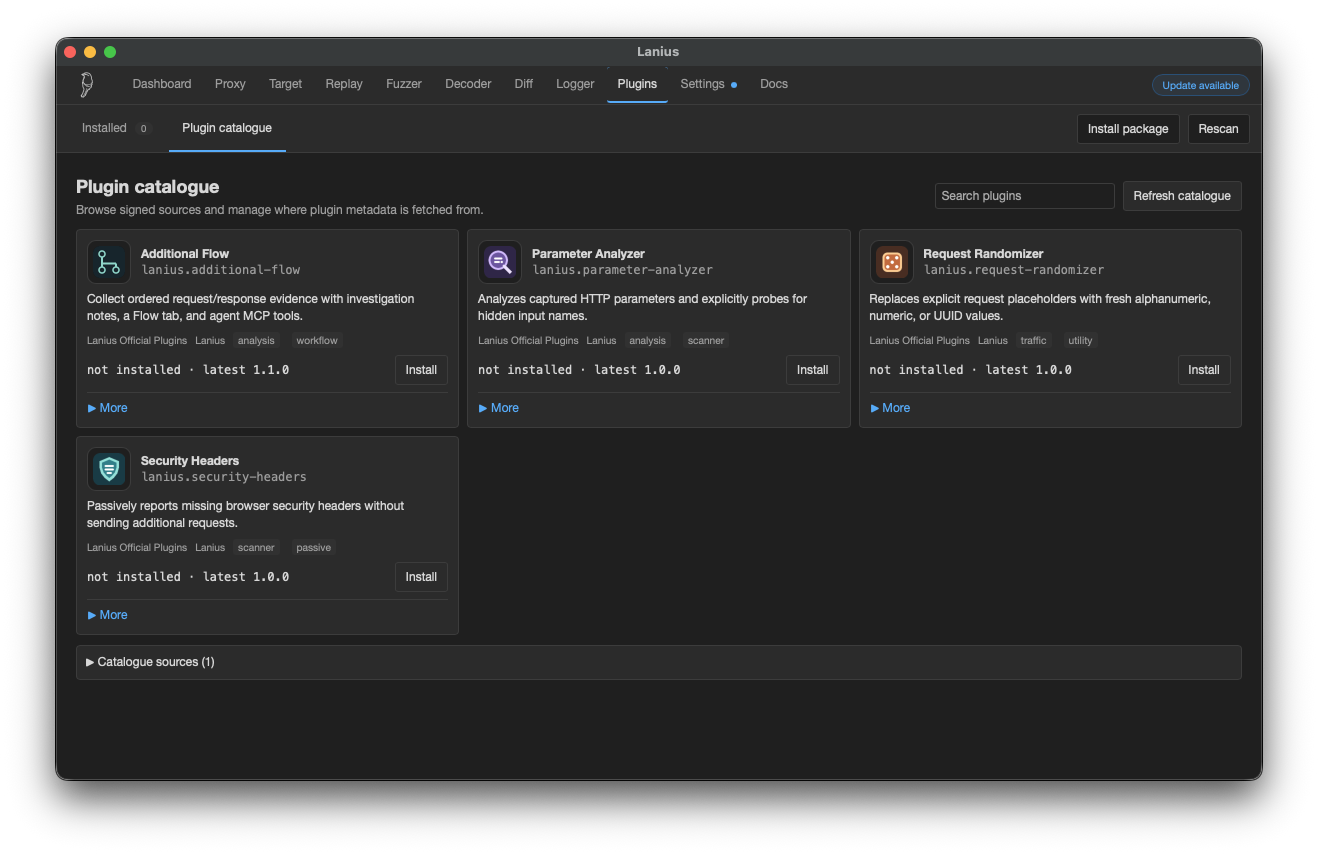 5. Extend the workflowBrowse signed catalogue releases and add focused analysis, automation, reporting, or testing capabilities to the desktop app.Plugin Catalogues →
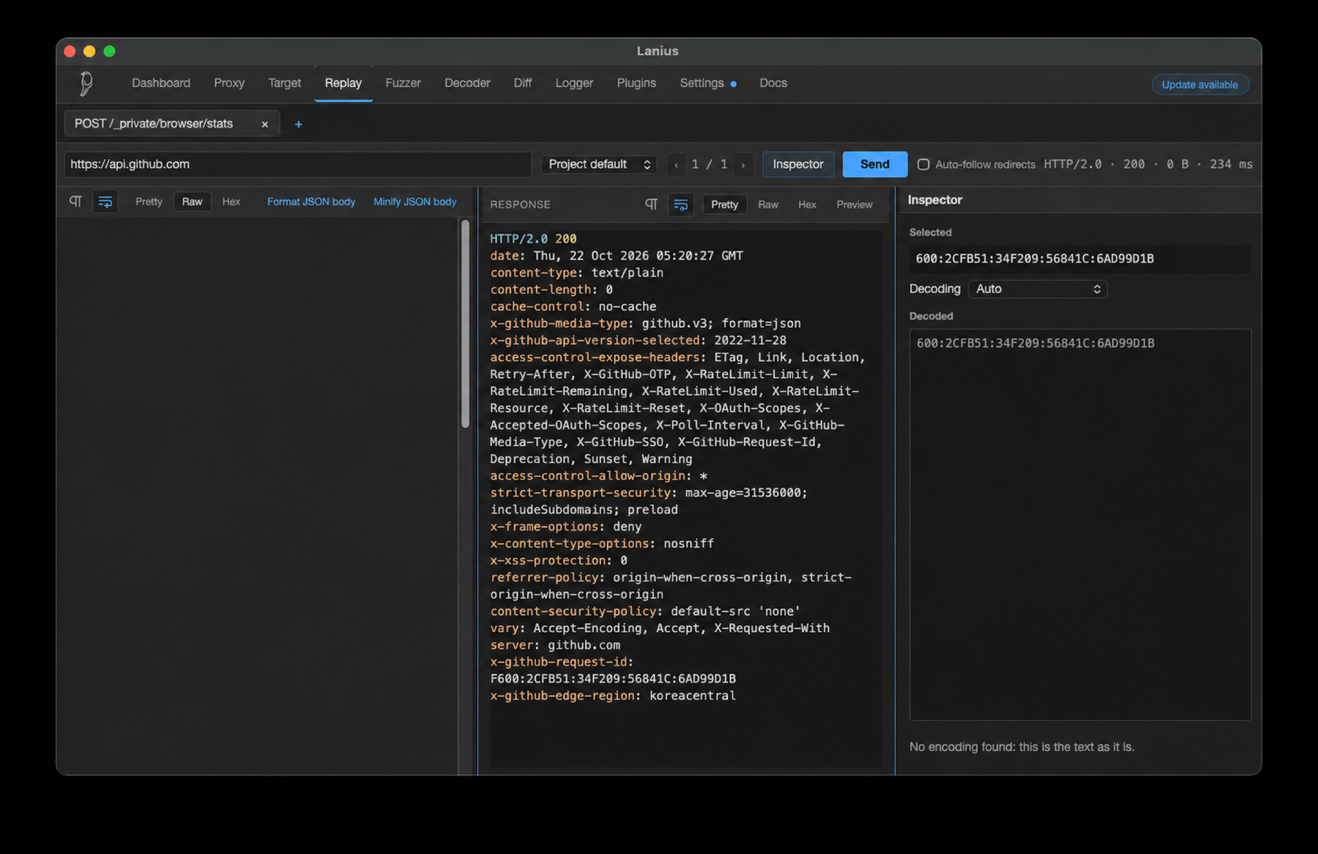 6. Replay with changesEdit a captured request, resend it, step through prior exchanges, follow redirects, and decode selected values beside the response.Replay →
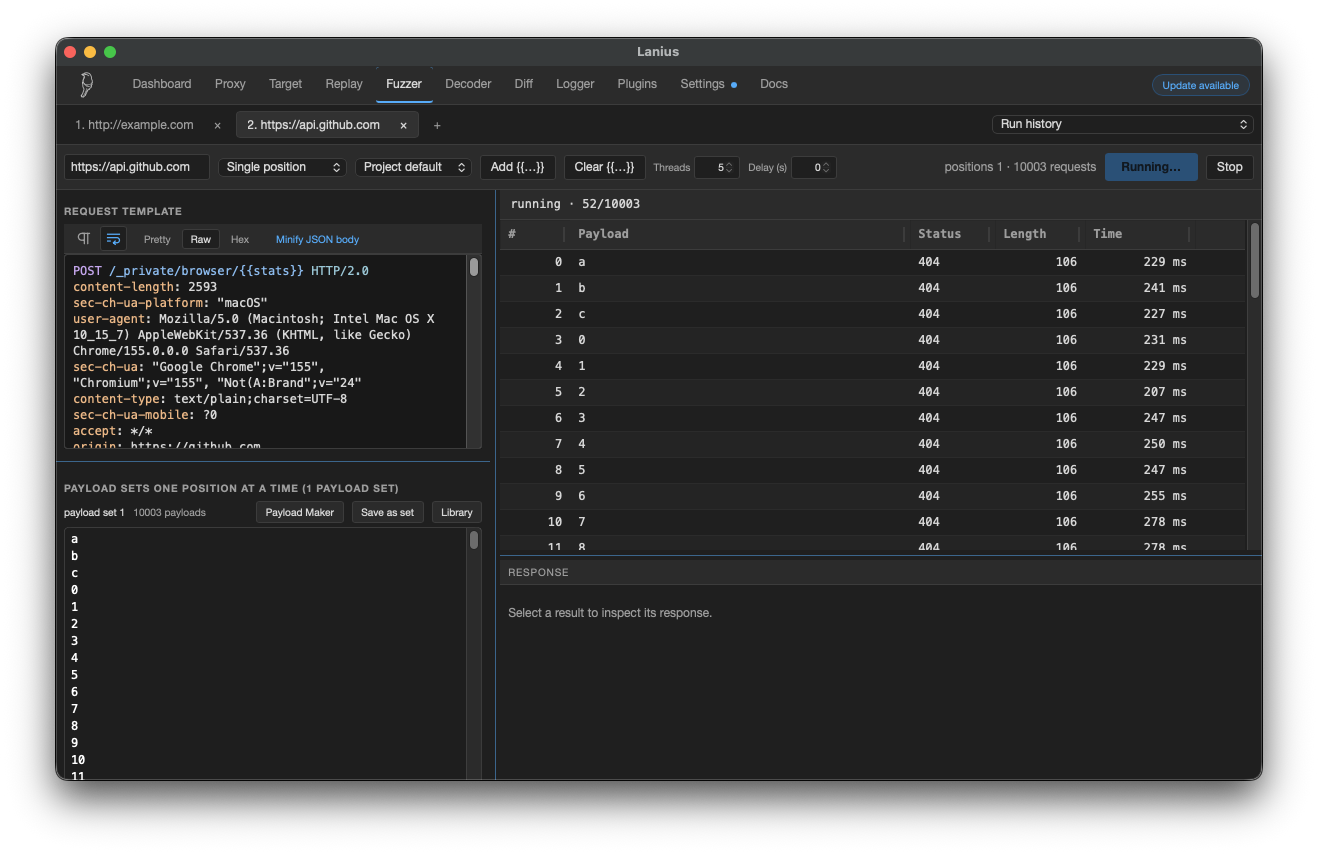 7. Run payload setsMark insertion points, choose a run strategy, and compare status, length, and timing while results stream into the table.Fuzzer →
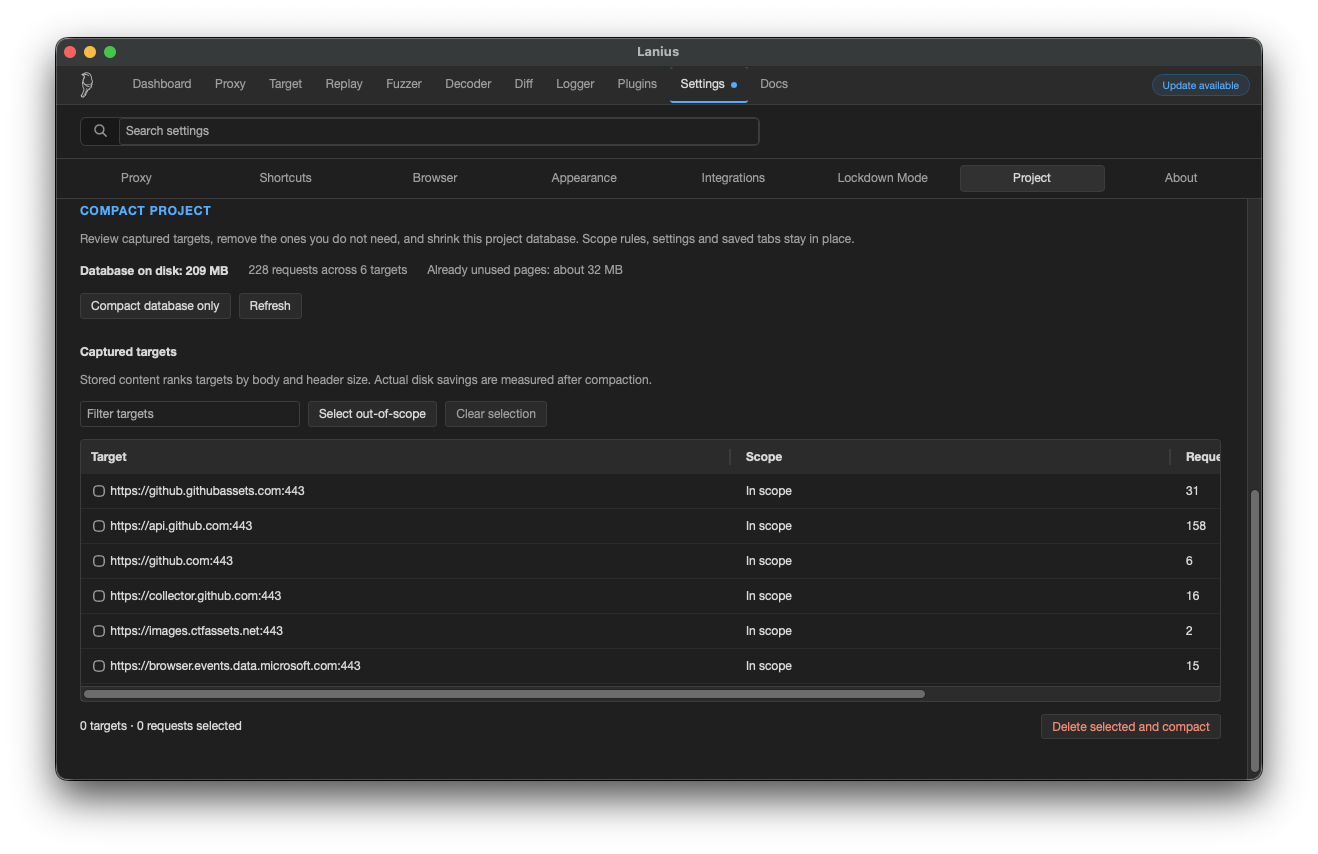 8. Keep the project leanReview storage by captured target, remove traffic that no longer matters, and compact the database without losing scope, settings, or saved tabs.Projects →
Ready to try the workflow? Download the latest release or follow Getting started.